

Hawai‘i Housing Planning Study, 2024
Prepared for:
Hawai‘i Housing Finance & Development Corporation
The Housing Crisis in Hawaiʻi: A Growing Challenge
Housing shapes lives in Hawaiʻi, but soaring costs and limited supply drive the state’s high cost of living, impacting health, work, and community stability. From healthcare to tourism, every sector feels the strain—housing instability harms well-being, worsens workforce shortages, and challenges families’ ability to stay.
The crisis grows as too many units become investments or short-term rentals, not homes. Slow construction, luxury-focused development, and scarce land, labor, and materials push prices higher, forcing residents into overcrowded conditions, homelessness, or out of state. Collective action is needed to ensure Hawaiʻi remains home for future generations.
2024 Hawai‘i Housing Planning Study (HHPS)
The 2024 HHPS, conducted by the Hawaiʻi Housing Finance & Development Corporation (HHFDC) with state and county support, analyzes housing needs through 2027. It explores supply, affordability, demand, and new topics like public transportation, special financing, and housing for Native Hawaiians and vulnerable groups, providing data to guide policy.
Key Findings
Need: 50,156 units (2020-2025); 64,490 by 2027.
Challenges: Post-2023 Maui fires (2,000 homes lost), outdated 2011-2019 data, and a growing gap since 2019.
Progress: Includes 13,471 pipeline units by 2027 and 27,563 units for market flexibility.
Methodology
The HHPS uses:
Housing inventory and price studies
A 2022-2023 Housing Demand Survey of 5,000+ households
A targeted 2023 DHHL Beneficiary Demand Survey of nearly 1,000 applicants, focusing on Native Hawaiian housing preferences
Interviews with housing developers and planners
Extensive analysis of special needs and Native Hawaiian housing
This comprehensive approach ensures robust insights despite limitations like pre-fire data and pending Census updates.

Download the Full Report
(Includes Addendums)
This website offers a comprehensive resource to understand and address Hawaiʻi’s housing crisis.
Navigate to the following sections to access critical information and tools:
Explore Housing Needs with Interactive Tools
Hawaiʻi’s housing crisis demands a nuanced understanding of eligible housing demand, as explored through the Table 39 and Table 39C Interactive Tools. These tools provide detailed insights into housing needs across household types, income levels, and tenures from 2020 to 2027, empowering stakeholders to analyze trends and make informed decisions. For a deeper dive into the data and methodology, refer to Section III of the housing report.
Table 39 Housing Needs Tool
The Table 39 Tool from the 2024 HHPS details Hawaiʻi’s need for 64,490 housing units (2023–2027) by county, type, tenure, and AMI affordability levels.
![[TABLE] Total Units Needed, 2023 through 2027](https://images.squarespace-cdn.com/content/v1/66a8072cf322172820bf66ed/d659eaf8-e189-4356-9e4a-1d63d5654345/Total+Units+Needed%2C+2023+though+2027)
Who It’s For
Housing professionals, policymakers, developers, and advocates can use this tool to guide development and policy decisions.
Why It’s Important
Table 39 highlights that 64% of needed units are for households earning ≤80% AMI, addressing the affordability crisis for vulnerable groups. With county-specific needs like Honolulu’s 25,712 units, it helps target resources and align development with actual demand.
Analyze DHHL-Eligible Housing Demand with the Interactive Tool
The DHHL-Eligible Households Interactive Tool, derived from the 2024 HHPS and the 2020 DHHL Beneficiary Study, details the need for 8,508 housing units for DHHL-eligible households by 2027, segmented by tenancy, type, and price across the state of Hawaiʻi.

Who It’s For
Housing professionals, policymakers, developers, and advocates, particularly those focused on Native Hawaiian communities, can use this tool to inform development and policy decisions tailored to DHHL applicants and eligible households.
Why It’s Important
The tool highlights that 55% of the 8,508 needed units (approximately 4,969) should target homeownership, with a strong preference for single-family homes on Hawai‘i Island (58.4% of applicants and 87.5% of eligible households). This concentrated demand suggests a need to increase Hawai‘i County’s housing allocation by 5,000–6,000 units to meet the preferences of DHHL-eligible households. For detailed insights into specific unit type preferences, refer to Section VI of the report. By providing data on tenure and geographic priorities, the tool enables stakeholders to align resources with the needs of Native Hawaiian beneficiaries, addressing short-term housing shortages effectively.
Hawai‘i’s Housing Crisis: Key Insights and Data
Hawai‘i’s housing market faces complex challenges, as captured in the selected charts below, which represent a subset of key findings from our comprehensive analysis. These visuals examine housing demand, affordability constraints, cost burdens, stock availability, and price dynamics driven by external buyers, offering critical data for stakeholders. For a deeper exploration of these trends and additional insights, refer to Section II of the housing report.
Housing Demand:
Units Needed by 2027
The "Housing Units Needed by County and AMI Level, 2023–2027" chart quantifies the state’s housing shortage, projecting a need for 64,490 new units by 2027, with 26.7% (17,242 units) designated for households earning ≤30% of the Area Median Income (AMI). This chart breaks down demand by county, offering insights into regional priorities. The next chart examines the affordability challenges renters face in meeting market rates.

Rental Affordability:
Financial Strain for Residents
The "Affordability Gap in 2022" infographic highlights the income required to afford a 2-bedroom rental, estimated at $41.83 per hour, far exceeding the earning capacity of minimum-wage workers ($12/hour in 2022). Additionally, 35,884 units are utilized as vacation homes, reducing available stock. This chart details the economic pressures on renters, setting the stage for an analysis of housing cost burdens.

Cost Burden:
Household Spending on Housing
The "Distribution of Housing Cost Burden by Income Share in Hawai‘i, 2022" chart reveals that only 43.6% of households spend less than 30% of their income on housing, while 20.5% allocate over 50%, indicating significant financial strain. This data emphasizes the prevalence of cost burdens across the state. The following chart explores trends in housing stock availability over time.

The "Housing Stock as a Percentage of Total Housing Units by County, 2010–2022" chart illustrates changes in housing stock from 2010 to 2022, highlighting county-specific patterns that impact availability. In addition to the chart’s findings, other county-level insights include:
Honolulu County: Represents 65.8% of total housing units (373,863 units) in 2022.
Hawai‘i County: Accounts for 16.0% of total housing units (90,673 units) in 2022, with 58.4% of DHHL applicants preferring relocation there.
Maui County: Comprises 12.8% of total housing units (72,941 units) in 2022, with 23.8% of households spending over 50% of income on housing.
Kaua‘i County: Holds 5.4% of total housing units (30,476 units) in 2022, with 11.6% of stock used for short-term rentals.
The next chart addresses how external buyers impact home prices.
Housing Stock: Trends and Availability
Housing Stock as a Percentage of Total Housing Units by County, 2010-2022

Home Prices:
Local vs. External Buyer Dynamics
The "Hawai‘i Home Price Differentials: Local vs External Buyers, 2008–2022" chart tracks price disparities, noting that out-of-state buyers paid 63.2% more than local buyers in 2022, with a 227.7% gap in Hawai‘i County. Approximately 25% of home sales over the past decade involved external buyers. This chart provides insight into market dynamics affecting affordability.
The data presented in these charts represent just a few of many critical insights into Hawai‘i’s housing crisis, from the pressing need for new units to the economic pressures faced by residents and the influence of external market forces. Much of this can be explored further by reading Section II of the housing report. To gain a deeper understanding of these trends and their implications, we invite you to explore each section in detail.
Table 39 Tool: Housing Units Needed in Hawaiʻi (2023–2027)
This table outlines the demand for 64,491 housing units across Hawaiʻi from 2023 to 2027, categorized by county, tenancy, type, and affordability (AMI levels). Explore the data using the Table 39 Interactive Tool, best experienced on desktop.
Toggle Variables: Filter by geography (e.g., Honolulu’s 25,712 units), tenancy, type, or AMI (e.g., 64% of units needed for ≤80% AMI).
Analyze Trends: Identify gaps, like Maui County’s need for 7,423 owner-occupied units or the state’s 14,020 rental units for ≤80% AMI.
Inform Decisions: Use insights to guide housing development and policy for local and vulnerable populations.
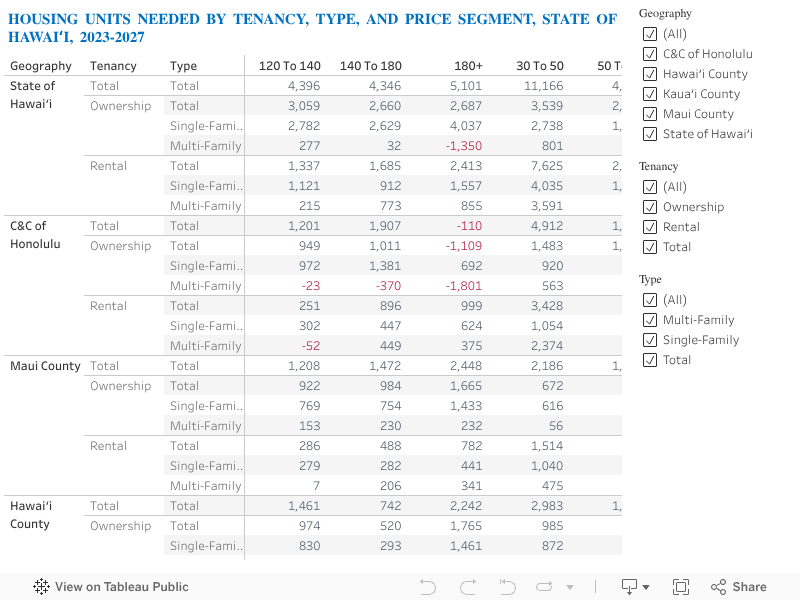
Table 39C Tool: DHHL-Eligible Housing Units Needed (2023–2027)
How to Use the DHHL-Eligible Households Interactive Tool
This interactive table details the demand for 8,508 housing units for DHHL-eligible households across Hawaiʻi by 2027, segmented by tenancy, unit type, price (AMI levels), and geography. Derived from the 2024 HHPS and the 2020 DHHL Beneficiary Study, the tool is best experienced on desktop.
Toggle Variables: Filter by geography (e.g., Hawai‘i Island’s 1,903 units), tenancy (e.g., 55% homeownership demand), unit type (e.g., single-family homes), or AMI level (e.g., 26% of units for ≤80% AMI rentals).
Analyze Trends: Identify gaps, such as the need for 4,679 owner-occupied units or the state’s 1,135 single-family rental units for ≤80% AMI.
Inform Decisions: Use insights to guide housing development and policy for DHHL applicants and Native Hawaiian beneficiaries.

Downloadable Report Sections: In-Depth Analysis & Data
Access the full depth of the 'Hawaii Housing Crisis: Key Insights and Data' report through downloadable PDF sections below. These resources provide comprehensive analyses, detailed data tables, and actionable insights into Hawaii’s housing challenges, including the need for 64,490 units by 2027 and specific demands like 8,508 units for DHHL-eligible households. Covering county-level breakdowns, affordability gaps, tenure types, and supply constraints, these sections equip housing professionals, policymakers, and advocates with the granular data needed to drive informed solutions.

Section II: Current Housing Situation in Hawai‘i
Key Highlights:
Only 21,415 (4.1%) of 568,058 housing units were vacant and available for residents in 2022.
35,884 units (9.1%) were used for seasonal/vacation purposes, with Kaua’i most impacted (11.6%).
57.8% of renters are cost-burdened, spending over 30% of income on housing.
Out-of-state buyers paid 63.2% more than locals, driving up prices.
Section II provides a snapshot of Hawai’i’s housing landscape in 2022, highlighting the challenges of limited supply, high costs, and competition from out-of-state buyers.

Section III: Needed Housing Units
Key Highlights:
64,490 units needed by 2027, with 65% (42,100) for households earning ≤ 80% AMI.
Honolulu needs 25,712 units (6.9% of 2022 stock); Hawai’i County needs 18,879 (20.8%).
Only 13,471 units are in the development pipeline, meeting 20.8% of the need.
26.7% of needed units (17,242) are for households earning ≤ 30% AMI.
Section III estimates the housing shortage in Hawai’i, projecting a need for 64,490 units by 2027, with a focus on low-income households.

Section IV: Housing Units Not Available to the Residential Market
Key Highlights:
35,884 units (9.1%) are used for seasonal/recreational purposes, reducing resident access.
Kaua’i has the highest share of unavailable units at 11.6%, compared to Honolulu’s 3.6%.
Out-of-state purchases totaled $6.12 billion in 2022, with buyers paying 63.2% more.
Military housing occupies 14% of O’ahu’s rental units, adding market pressure.
Section IV examines why 35,884 housing units are unavailable to residents, focusing on vacation rentals, seasonal homes, and out-of-state ownership.

Section V: Policy Opportunities
Key Highlights:
20.3% of respondents would buy a townhouse/condo with a 65-year lease and shared equity; 44.5% would consider a single-family home with a 99-year lease and limited equity.
11,000+ subsidized units are at risk of converting to market-rate by 2045.
Maui households face high housing cost burdens, with nearly a quarter paying ≥ 50% of income on housing, impacting combined housing and transportation costs.
Act 310 (2022) prohibits discrimination against voucher holders, aiding homeless clients.
Section V proposes policy solutions to address the housing crisis, including sustainable affordability measures and transportation integration.

Section VI: Segments Within The Housing Market
Key Highlights:
8,508 units needed for DHHL-eligible households by 2027, with 55% for ownership.
53% of DHHL lessees/applicants earn ≤80% AMI; 66% of HHCA-eligible households are in this bracket.
37% of homeless households served (3,089) are Native Hawaiian; only 11% (332) exited to permanent housing.
40,000 households plan to leave Hawai’i within 5 years, with 60.8% citing housing costs.
Section VI focuses on the housing needs of Native Hawaiians, DHHL beneficiaries, and strategies to retain residents in-state.

Section VII: Housing Need of Government Program Clients
Section VII addresses the housing needs of special populations, including the homeless, seniors, and individuals with special needs.
Key Highlights:
7,303 homeless households remained unhoused in 2022, with 90% being individuals.
12,400+ individuals with special needs require housing, including seniors and those with mental illness.
By 2030, 17,598 care home beds will be needed for seniors, a 4,300-bed increase from 2021.
Many homeless heads of households in Hawai‘i are employed, yet their average monthly income of $1,696 falls short of the state’s average one-bedroom rent of $1,763, underscoring a persistent affordability challenge.

The 2024 HHPS Appendix provides detailed data and tables that support the findings of the Hawai‘i Housing Planning Study 2024 Report. It includes housing trends, demographic data, and adjustments to housing supply and demand across the State of Hawai‘i and its counties.